histogram_2d_gauge
- class cockpit.instruments.histogram_2d_gauge(self, fig, gridspec, transformation=None, marginals=True, idx=None)[source]
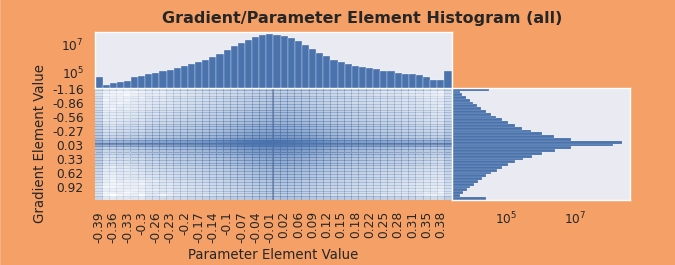
Two-dimensional histogram of the individual gradient and parameter elements.
This instrument provides a combined histogram of parameter-gradient pairs of the network. The values are collected across an entire mini-batch and thus captures indvidual gradients as well. The marignal distributions across the parameters and gradient values are shown at the top and right respectively.
The histogram shows the distribution of gradient and parameter elements for the last tracked iteration only.
Preview
Requires
This two dimensional histogram instrument requires data from the
GradHist2dquantity class.- Parameters
self (CockpitPlotter) – The cockpit plotter requesting this instrument.
fig (matplotlib.figure.Figure) – Figure of the Cockpit.
gridspec (matplotlib.gridspec.GridSpec) – GridSpec where the instrument should be placed
transformation (callable) – Some map applied to the bin values as a transformation for the plot. Defaults to None which means no transformation.
marginals (bool) – Whether to plot the marginal histograms as well.
idx (int) – Index of parameter whose histogram data should be used. If
None(default), uses data of all parameters.