histogram_1d_gauge
- class cockpit.instruments.histogram_1d_gauge(self, fig, gridspec, y_scale='log')[source]
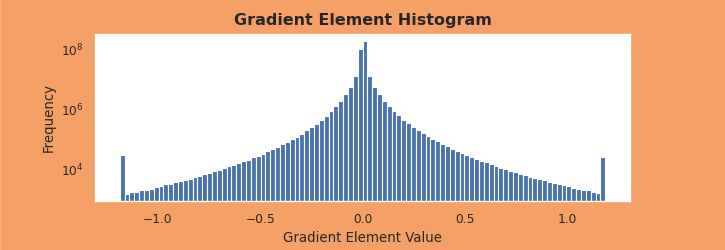
One-dimensional histogram of the individual gradient elements.
This instrument provides a histogram of the gradient element values across all individual gradients in a mini-batch. The histogram shows the distribution for the last tracked iteration only.
Preview
Requires
This two dimensional histogram instrument requires data from the
GradHist1dquantity class.- Parameters
self (CockpitPlotter) – The cockpit plotter requesting this instrument.
fig (matplotlib.figure.Figure) – Figure of the Cockpit.
gridspec (matplotlib.gridspec.GridSpec) – GridSpec where the instrument should be placed
y_scale (str, optional) – Scale of the y-axis. Defaults to “log”.